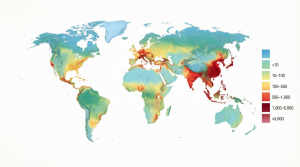
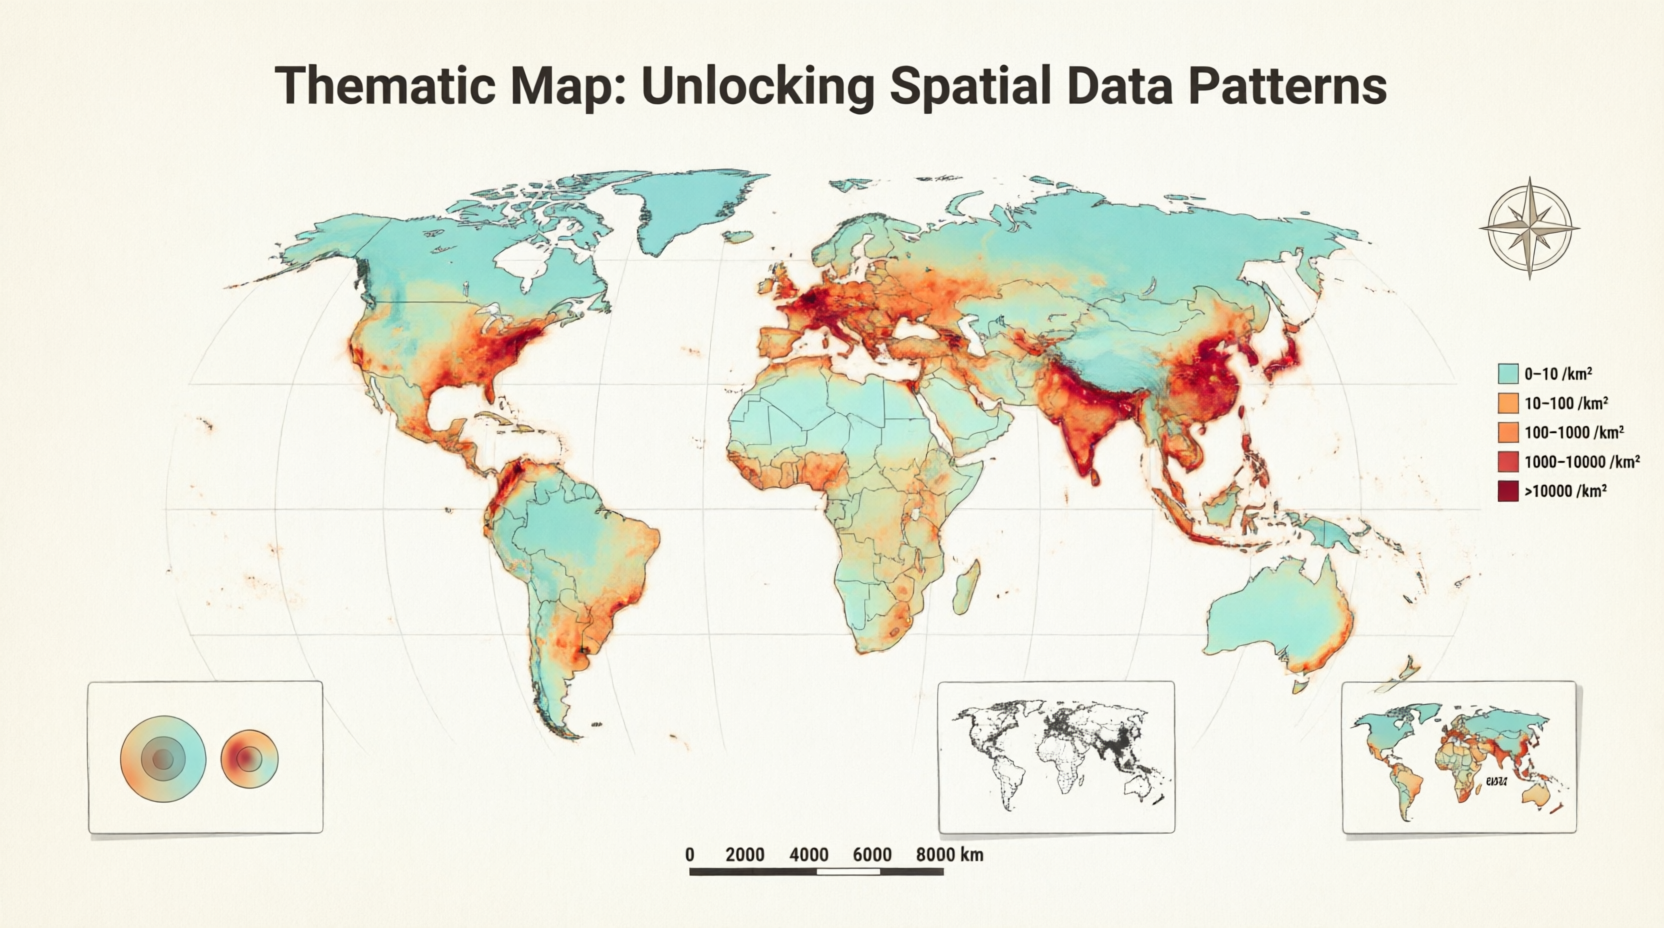
If you’ve ever glanced at a colorful election map showing voting patterns by state or checked a weather dashboard highlighting temperature variations across cities, you’ve already seen the power of a thematic map in action. These maps do much more than point out where places are located. They reveal stories hidden in numbers by showing how a specific theme or variable changes across geographic space. Whether you’re tracking population growth, income levels, or environmental risks, a thematic map turns complex datasets into visuals that spark understanding and drive better decisions.
In essence, a thematic map serves as a specialized tool in cartography and data visualization. It emphasizes the spatial distribution and patterns of one main theme rather than trying to show every road, river, or border at once. This focused approach makes it incredibly useful for analysts, educators, policymakers, and even everyday curious minds who want to grasp trends quickly. As data volumes explode in our digital age, mastering the thematic map has become a valuable skill for anyone interested in geography, business intelligence, or storytelling with numbers.
Understanding What a Thematic Map Really Shows
A thematic map stands out because it prioritizes a single subject or dataset layered over a simple geographic base. Think of it as a storyteller that uses color, symbols, or lines to highlight variations like poverty rates by neighborhood or rainfall amounts across a continent. The base elements, such as country outlines or major cities, exist only to provide context, not as the main attraction. This design choice helps viewers instantly spot clusters, gradients, or outliers that raw spreadsheets often hide.
What makes a thematic map truly effective is its ability to communicate abstract ideas visually. For example, instead of listing city populations in a table, a thematic map might use larger circles to represent larger cities, so you can compare sizes at a glance. Cartographers carefully choose symbols, colors, and classification methods to avoid misleading viewers. When done right, these maps foster deeper insights into social, economic, or environmental issues and support everything from urban planning to public health responses.
The Fascinating History Behind Thematic Maps
Thematic mapping as we know it blossomed during the Industrial Age, though its roots stretch back to the Enlightenment. Early innovators realized that maps could do more than just navigate; they could also analyze and persuade. One landmark example came in 1701 when Edmond Halley created a chart showing lines of equal magnetic variation, often considered one of the first true thematic maps. By the 1800s, pioneers like Charles Dupin produced the earliest choropleth maps, while John Snow famously used a thematic map in 1854 to trace cholera deaths to a contaminated water pump in London.
As noted in cartographic history, almost all modern graphical techniques for thematic maps were invented between 1700 and 1850. The real explosion occurred in the mid-20th century, with the quantitative revolution in geography, the widespread adoption of computing, and the rise of geographic information systems. Suddenly, anyone with data and software could create sophisticated thematic maps. Today, these tools continue evolving, blending traditional cartography with interactive web technologies to make complex information accessible to global audiences.
Exploring the Main Types of Thematic Maps
Different themes and data types call for different approaches, which is why several distinct thematic map styles exist. Choropleth maps shade regions with colors that represent data ranges, making them ideal for comparing aggregated statistics such as county-level unemployment rates. Proportional symbol maps use circles or icons sized to values at specific points, making them ideal for showing city populations or earthquake magnitudes. Dot density maps use repeated dots to show the distribution of counts across an area. Isarithmic maps connect equal values with lines, making them useful for continuous phenomena such as temperature or pressure. Flow maps use lines to show movement between places, helping illustrate traffic, trade, or migration patterns.
Here’s a quick comparison of popular types to help you choose wisely:
| Choropleth | Regional aggregated data | Color shading of areas | Median income by state | Easy regional comparisons | Can hide internal variation |
| Graduated Symbol | Point-based quantities | Sized symbols (circles) | Airport passenger traffic | Shows absolute values clearly | Overlap in dense areas |
| Dot Density | Distribution of counts | Scattered dots | Population spread across a country | Reveals true spatial patterns | Dots can cluster misleadingly |
| Isarithmic/Isopleth | Continuous phenomena | Lines or shaded contours | Temperature or elevation gradients | Smooth transitions shown well | Requires dense data points |
| Cartogram | Emphasizing disparities | Distorted region shapes | World population by country size | Makes big differences obvious | Geography becomes unfamiliar |
| Flow Map | Movement or connections | Lines with varying thickness | Trade routes or migration flows | Visualizes relationships | Can become cluttered |
Each style has strengths and ideal scenarios. A skilled mapmaker selects the right one based on whether the data is discrete or continuous, and whether it is qualitative or quantitative.
Thematic Map vs Reference Map: Knowing the Difference
You might wonder how a thematic map differs from the everyday maps we use for navigation. A reference map focuses on showing where things are located — think political boundaries, highways, rivers, and cities, all treated with equal importance. Its goal is general orientation and location finding. In contrast, a thematic map deliberately de-emphasizes most background features to spotlight patterns in one specific variable.
Both types often appear together in modern applications. A city planning department might use a reference map as the base layer while overlaying a thematic map showing traffic accident hotspots. Understanding this distinction helps you pick the right tool for the job and interpret visuals correctly. Reference maps answer “Where am I?” while thematic maps answer “What’s happening here and why does it matter?”
Step-by-Step Guide to Creating Your Own Thematic Map
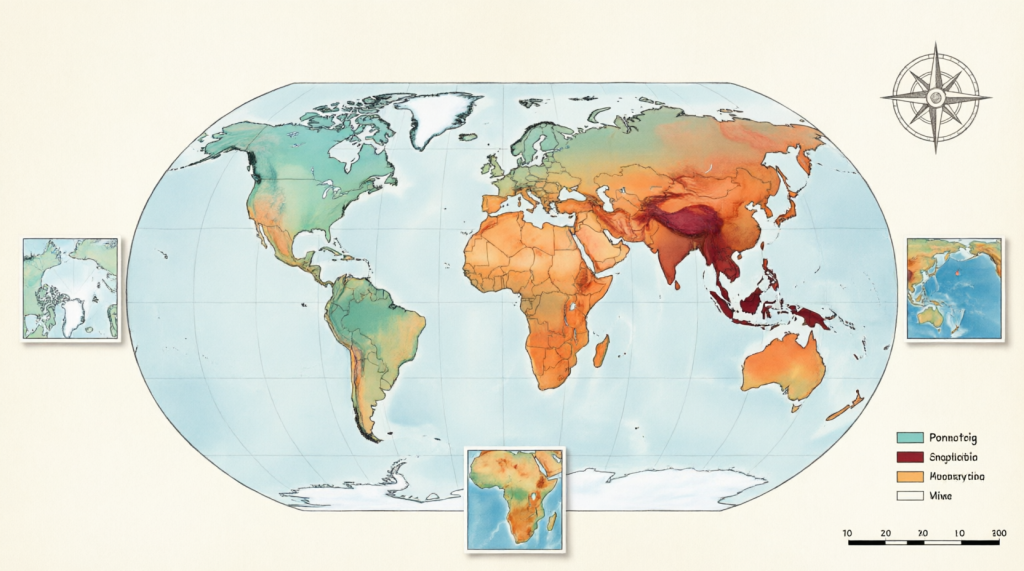
Creating a thematic map has never been more approachable, even if you’re not a professional cartographer. Start by defining your theme and gathering reliable geospatial data from sources like census bureaus or open data portals. Next, choose your map type based on the data structure — choropleth for regional stats or graduated symbols for point values.
Then select user-friendly software and import your data. Classify the numbers thoughtfully using methods such as natural breaks or quantiles, choose an accessible color palette, and add a clear legend, scale bar, and source citation. Finally, test your map with a few people to ensure the patterns are obvious and not misleading. Modern tools let you publish interactive versions online in minutes, turning static images into shareable experiences that invite exploration.
Real-World Applications Where Thematic Maps Shine
Thematic maps power decision-making across countless fields. Public health officials rely on them to track disease outbreaks and allocate resources efficiently. Marketers use them to identify underserved neighborhoods for targeted campaigns. Environmental scientists create thematic maps of deforestation or air quality to advocate for policy changes and raise public awareness.
In education, teachers use simple thematic maps to help students visualize concepts like global wealth distribution or climate zones. Businesses analyze customer density or supply chain flows through thematic mapping to optimize operations. During elections, journalists and analysts produce real-time thematic maps that help citizens understand voting trends and demographic influences. These practical uses demonstrate why the thematic map remains one of the most versatile tools in the data visualization toolkit.
Tools and Software to Bring Your Thematic Map to Life
You don’t need expensive equipment or years of training to start making thematic maps. Free and open-source options like QGIS offer professional-grade capabilities for choropleth, dot density, and isarithmic styles. Web-based platforms such as Datawrapper and Flourish provide templates for quick choropleth or symbol maps from spreadsheet data.
For more advanced users, ArcGIS Online and CARTO deliver powerful interactive features and collaboration tools. Even spreadsheet programs and business intelligence software like Tableau or Power BI now include built-in mapping functions. Many of these tools integrate with public boundary datasets, making it simple to match your statistics to geographic areas. The key is to start small, experiment with sample data, and gradually add complexity as your confidence grows.
Pro Tips and Common Pitfalls in Thematic Mapping
Great thematic maps share several qualities: clear purpose, honest data representation, and thoughtful design. Always include a descriptive title, legend, and data source so viewers understand what they’re seeing. Choose colors that are accessible to people with color vision differences and avoid overly bright rainbow schemes for sequential data. Simplify boundaries when working with large datasets to keep maps responsive and readable.
Common mistakes include using the wrong map type for your data, poor classification that hides important patterns, or overcrowding the visual with too many elements. Another frequent issue is forgetting that maps can influence opinions — ethical cartographers always strive for accuracy and transparency. By keeping your audience in mind and iterating based on feedback, you’ll create thematic maps that inform rather than confuse.
The Future of Thematic Maps in a Data-Driven World
As technology advances, thematic maps are becoming more interactive, real-time, and multidimensional. Bivariate and multivariate versions now show relationships between two or more variables on a single view. Animated and 3D thematic maps add time and depth, while integration with augmented reality promises even more immersive experiences. Artificial intelligence is also helping automate classification and suggest optimal visual variables.
Despite these innovations, the core purpose remains timeless: helping humans understand spatial patterns quickly and intuitively. In an era of big data and global challenges like climate change and inequality, the thematic map will only grow in importance as a bridge between raw information and actionable knowledge. Whether you’re a student, professional, or curious explorer, learning to read and create these maps opens doors to clearer thinking about our interconnected world.
Conclusion
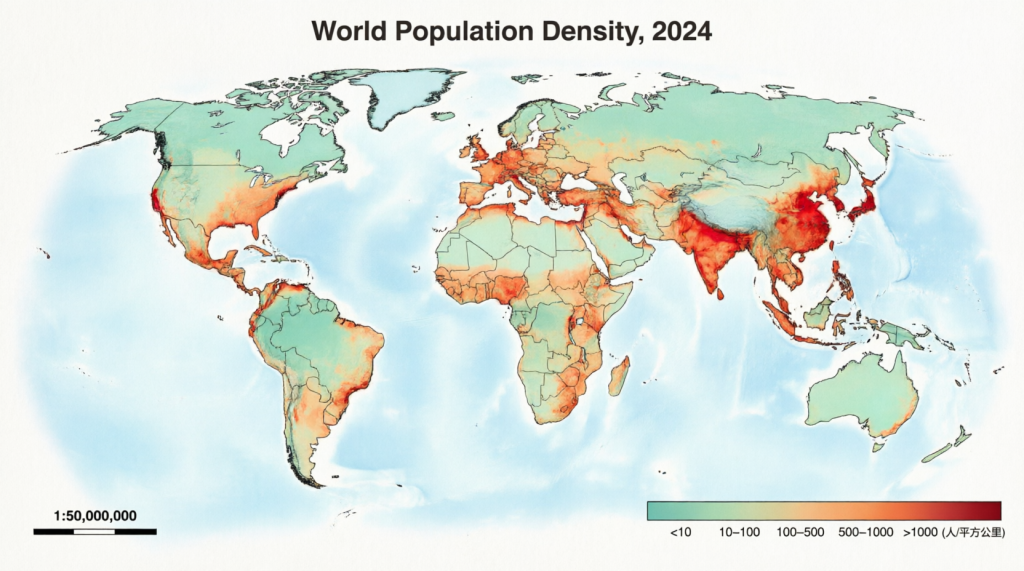
Thematic maps have evolved from rare scientific curiosities into everyday tools that shape how we understand and respond to the world around us. By focusing on specific themes and revealing spatial patterns, they transform overwhelming datasets into clear, compelling narratives. From historical breakthroughs like John Snow’s cholera map to today’s interactive dashboards tracking everything from election results to environmental changes, these maps continue proving their value across industries and disciplines.
Whether you’re analyzing business trends, teaching geography, or simply exploring data for fun, incorporating thematic mapping into your toolkit will sharpen your insights and communication skills. The next time you see a colored region or sized symbol on a map, you’ll appreciate the thoughtful design behind it — and maybe even feel inspired to create one of your own. Start experimenting today, and discover how a well-crafted thematic map can turn numbers into knowledge that truly matters.
Frequently Asked Questions
What exactly is a thematic map, and how does it help people better understand data?
A thematic map is a specialized type of map designed to display the geographic pattern of one particular theme or variable, such as income levels or temperature, across a region. Unlike general maps that focus mainly on locations, thematic maps use colors, symbols, or lines to highlight variations and relationships in the data. This visual approach makes complex information easier to grasp quickly, revealing trends, clusters, and outliers that might stay hidden in tables or text. People use thematic maps in fields from public health to marketing because they turn abstract statistics into intuitive stories that support smarter decisions and clearer communication.
How do the different types of thematic maps compare, and which should I choose for my project?
Several main types of thematic maps exist, each suited to specific kinds of data and storytelling goals. Choropleth maps shade areas by value ranges and work well for regional statistics, such as state-level unemployment. Graduated symbol maps use differently sized icons at points to show quantities such as city populations. Dot density maps scatter dots to represent counts and reveal true distribution patterns, while isarithmic maps use contour lines or shading to represent continuous data such as rainfall. Cartograms distort shapes to emphasize a variable, and flow maps illustrate movement. Choose based on whether your data is aggregated by area, tied to points, or continuous, and always match the style to what you want viewers to notice most.
What’s the key difference between a thematic map and a standard reference map?
A thematic map and a reference map serve different primary purposes even though they sometimes appear together. Reference maps emphasize location and general features such as roads, rivers, and political boundaries so users can orient themselves and find places. A thematic map, by contrast, uses the geographic base mainly as context while spotlighting the distribution and patterns of one specific theme or dataset. Reference maps answer “Where is this?” while thematic maps answer “How does this theme vary across space and what does it mean?” Understanding both helps you select and interpret maps correctly, depending on whether you need navigation or analytical insight.
Can beginners create professional-looking thematic maps, and what tools make the process simple?
Absolutely — modern tools have made creating a thematic map accessible even for beginners with no prior cartography experience. Free platforms like QGIS provide powerful options for all major map types, while web apps such as Datawrapper and Flourish offer templates that generate beautiful choropleth or symbol maps from simple spreadsheet uploads in minutes. Business tools like Tableau and Power BI include built-in mapping features, and many come with ready-to-use boundary datasets. Start with clean data, pick an appropriate map style, apply thoughtful colors and classifications, and add clear labels. With a bit of practice, you can produce shareable, publication-quality thematic maps that effectively communicate your message.
How are thematic maps being used today to address important global and local issues?
Thematic maps play vital roles in tackling challenges from climate change and public health to economic development and social equity. Health agencies create them to track disease spread and target interventions, while environmental groups use them to visualize pollution levels or habitat loss and push for policy action. Urban planners rely on thematic maps for traffic analysis and infrastructure decisions, and journalists employ them to explain election results or demographic shifts to the public. In business, companies analyze customer distribution or supply chain patterns through thematic mapping. As interactive and real-time versions become more common, these maps continue helping communities and organizations turn data into meaningful understanding and coordinated responses to pressing issues.