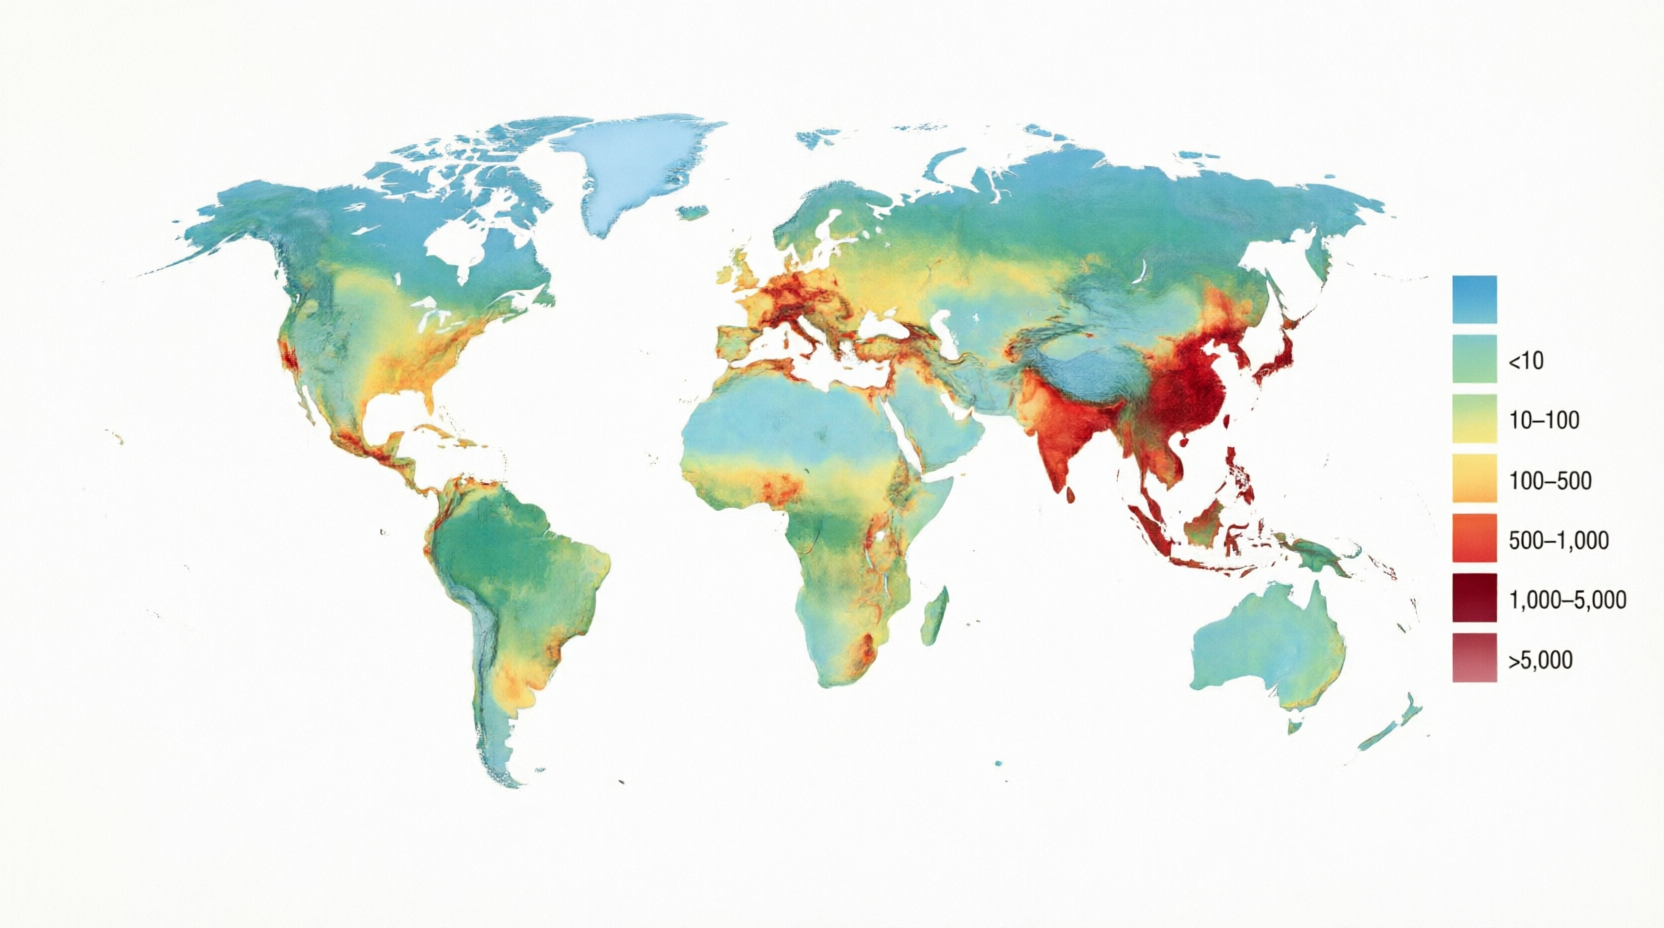
If you have ever looked at a weather map showing temperature zones or an election night graphic highlighting voting results by state, you have already seen a thematic map in action. So what is a thematic map exactly? It is a specialized type of map designed to highlight a single theme or dataset across geographic space rather than simply showing locations. These maps use colors, symbols, patterns, or distortions to reveal spatial patterns, distributions, and relationships that would stay hidden on a standard map.
Thematic maps focus on telling a story with data. They take numbers about things like income levels, disease spread, rainfall, or population density and turn them into something you can see and understand at a glance. Unlike general maps that try to show everything at once, a thematic map zooms in on one idea and uses the geography as a canvas to make that idea pop. This focused approach makes them powerful tools for anyone from students and journalists to city planners and business analysts.
People often create thematic maps to answer questions like “Where are the highest rates of something happening?” or “How does this factor change from one region to another?” Because they emphasize patterns over pure location, they help us spot trends, compare areas, and make smarter decisions. In today’s data-rich world, understanding what a thematic map is gives you a real advantage when reading news graphics or exploring interactive dashboards online.
How Thematic Maps Differ from Everyday Reference Maps
Most maps you use for navigation or general information are reference maps. They show roads, rivers, cities, borders, and physical features all together so you can find your way or understand basic geography. A road atlas or a political world map falls into this category because its main job is to answer “Where is this place?”
A thematic map works differently. It takes one specific topic and layers it over a simplified base so your attention stays on the data story. The base map might still show country outlines or major cities, but only as quiet context. The real star is the theme, whether that is unemployment rates shaded by color or dots scattered to show where people live. Cartographers often describe the contrast this way: reference maps show where something is in space, while thematic maps tell a story about that place.
This difference matters because it changes how you read the map. On a reference map, you hunt for a specific landmark. On a thematic map, you look for clusters, gradients, or surprising gaps. Both types are useful, but they serve opposite purposes. Reference maps orient you. Thematic maps inform and persuade you with visible evidence.
The Fascinating History Behind Thematic Mapping
Thematic mapping did not appear overnight. Early roots trace back to the late 1600s when scientists began using maps to display ideas beyond simple coastlines. English astronomer Edmond Halley created one of the first true examples in 1686 with a map of trade winds and another in 1701 showing lines of equal magnetic variation across the Atlantic. These were groundbreaking because they visualized invisible forces rather than visible land features.
The real boom came in the 1800s during the rise of statistics and national censuses. French engineer Charles Dupin produced an early choropleth map in 1826, shading regions by education levels. English physician John Snow famously used a dot map in 1854 to trace a cholera outbreak in London to a single contaminated water pump. French engineer Charles Joseph Minard created his legendary flow map in 1869, showing Napoleon’s disastrous Russian campaign, with line thickness representing troop numbers that shrank dramatically during the retreat. These examples proved that maps could do more than locate places. They could explain causes and consequences.
By the twentieth century, thematic cartography became a recognized field with its own rules for color, symbols, and data classification. The arrival of computers and geographic information systems in the late 1900s made creating these maps faster and more accurate than ever before.
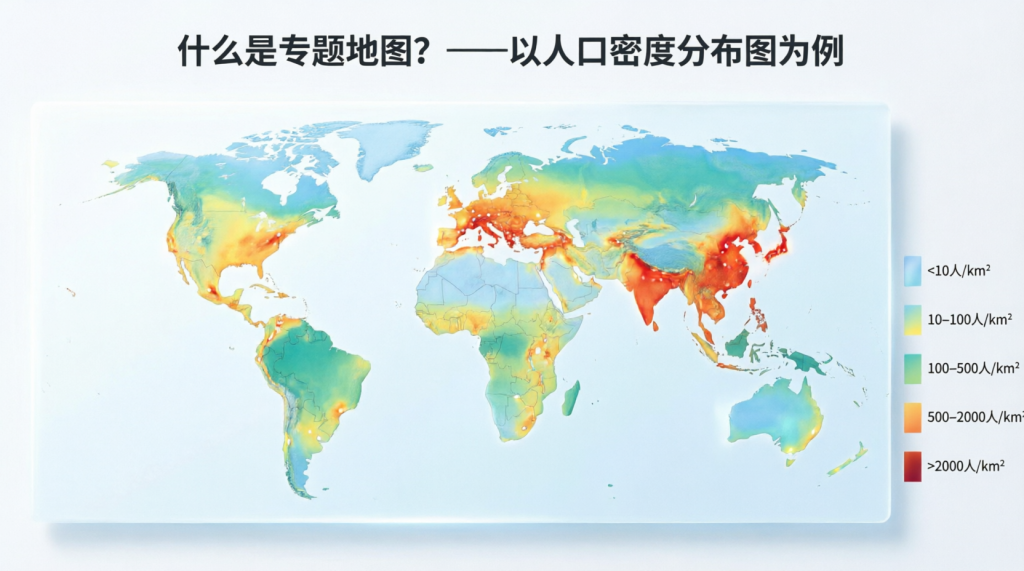
Popular Types of Thematic Maps You Should Know
Not all thematic maps look the same because different data needs different visual tricks. Cartographers choose the style that best matches the numbers they want to share and the message they hope to deliver.
Choropleth maps are probably the most common. They shade or color entire regions, such as states or counties, based on average values. Darker shades usually mean higher numbers. These work well for rates and percentages, but can be misleading if the regions vary greatly in size.
Dot density maps scatter small dots across areas so each dot represents a certain quantity, such as one dot for every thousand people. The result shows both the total numbers and the degree of spread or clustering of the phenomenon.
Graduated symbol maps, sometimes called proportional symbol maps, place circles or other shapes at specific points and change their size based on the value. A big circle over a city might represent a high population, while a tiny one shows a small town.
Cartograms take a bold approach by resizing regions themselves. Countries or states grow or shrink based on the data, so a nation with a huge population might appear massive even if its actual land area is small.
Flow maps use arrows or lines whose thickness or color indicates movement and volume, making them perfect for trade routes, migration, or traffic between places. Isoline maps connect points of equal value with lines, creating smooth patterns for things like temperature or elevation that change gradually across space.
Here is a quick comparison of some popular styles:
| Choropleth | Colors or shades whole regions | Rates and averages by area | Median income by state |
| Dot Density | Scatters dots, each worth a set amount | Absolute counts and distribution | Population spread across a country |
| Graduated Symbol | Changes symbol size at points | Magnitudes at specific locations | City populations or earthquake strength |
| Cartogram | Resizes areas by the data value | Comparisons that ignore land size | Countries sized by GDP or population |
| Flow Map | Lines or arrows with varying thickness | Movement and connections | Trade flows or refugee routes |
| Isoline | Lines connecting equal values | Continuous gradual change | Rainfall or temperature patterns |
Each type has strengths and ideal situations. Choosing the right one is part of the art and science of thematic cartography.
Real-Life Examples Where Thematic Maps Make a Big Difference
You see thematic maps almost every day without always realizing it. Television weather reports use isoline and choropleth styles to show temperature and precipitation. News outlets rely on choropleth maps during elections to display which candidate won each district. Public health agencies created countless dot and heat maps during the COVID-19 pandemic to track case clusters and vaccination progress.
Urban planners use graduated symbol maps to decide where to build new schools or hospitals based on population clusters. Environmental scientists create choropleth maps of air quality or deforestation rates to argue for policy changes. Businesses analyze dot density maps of customer locations to choose store sites or delivery routes. Even simple apps on your phone that show traffic or restaurant density are forms of thematic mapping.
These real-world uses prove that thematic maps are not just academic exercises. They make decisions that affect communities, economies, and the environment every single day.
Why Thematic Maps Are Incredibly Useful Tools
The biggest strength of a thematic map is its ability to reveal hidden patterns quickly. Our brains process visual information much quicker than tables of numbers. A well-designed thematic map lets you spot clusters, outliers, and trends in seconds that might take hours to notice in spreadsheets.
They also support better decision-making. City leaders can see which neighborhoods need more resources. Researchers can compare regions across time or between countries. Teachers use them to help students grasp big concepts like global inequality or climate zones. Journalists rely on them to make complex stories accessible to general audiences.
Thematic maps also encourage curiosity. Once you understand what a thematic map is, you start noticing them everywhere and asking better questions about the data behind the pretty colors.
Potential Pitfalls When Interpreting Thematic Maps
Even great thematic maps can mislead if you are not careful. Choropleth maps sometimes make large rural areas look more important than dense cities simply because of size. Classification choices, such as how the data is divided into color groups, can dramatically change the story the map appears to tell. Poor color choices can confuse people with color blindness or create false impressions of severity.
Cartograms sacrifice accurate shapes and distances, which can disorient viewers who expect familiar geography. Dot maps can give the false impression that events occurred at exact dot locations, even though the dots are often randomly placed within regions.
The lesson is simple: always check the legend, understand what the data actually measures, and remember that every map is a simplified version of reality. Good thematic cartography tries to minimize these issues, but readers still need to stay alert.
Creating Your Own Thematic Map in Today’s Digital Age
You no longer need to be a professional cartographer to make a thematic map. Free tools like QGIS let anyone import data and design choropleth or graduated symbol maps. Online platforms such as ArcGIS Online, Tableau, or even Google’s My Maps offer easier drag-and-drop options for beginners. Many government websites provide ready-to-use datasets on population, health, and economics that you can turn into maps in minutes.
The process usually involves three steps: gather reliable data, choose the right map type for your message, and design with clear colors, legends, and labels. Modern GIS software handles much of the technical work, but thoughtful design choices still make the difference between a confusing graphic and an insightful one.
What the Future Holds for Thematic Mapping
Thematic mapping keeps evolving quickly. Interactive web maps now let users click regions for more details or slide through time to watch changes unfold. Animated and 3D versions add depth that static paper maps could never achieve. Artificial intelligence is starting to help with automatic classification and even suggesting the best map type for a given dataset.
Real-time data from sensors, satellites, and mobile phones means thematic maps can update by the minute for things like traffic, air quality, or social media trends. Virtual and augmented reality may soon let people walk through data landscapes rather than just look at them on a screen. Whatever the technology, the core goal stays the same: helping people understand complex spatial information through clear visual stories.
Conclusion
Thematic maps have come a long way from Halley’s early wind charts to today’s interactive dashboards, yet their purpose remains beautifully simple. They turn abstract numbers into visible patterns so we can understand our world better and make wiser choices. Whether you are studying for school, following the news, planning a business, or just curious about your community, knowing what a thematic map is opens up a clearer way to see data all around you.
Next time you glance at a colored election map or a temperature graphic, take a moment to appreciate the thought that went into it. These maps do more than decorate reports. They help us notice what matters and act on it. The more comfortable you become reading and creating them, the better equipped you will be to navigate an increasingly data-driven planet.
What exactly is a thematic map?
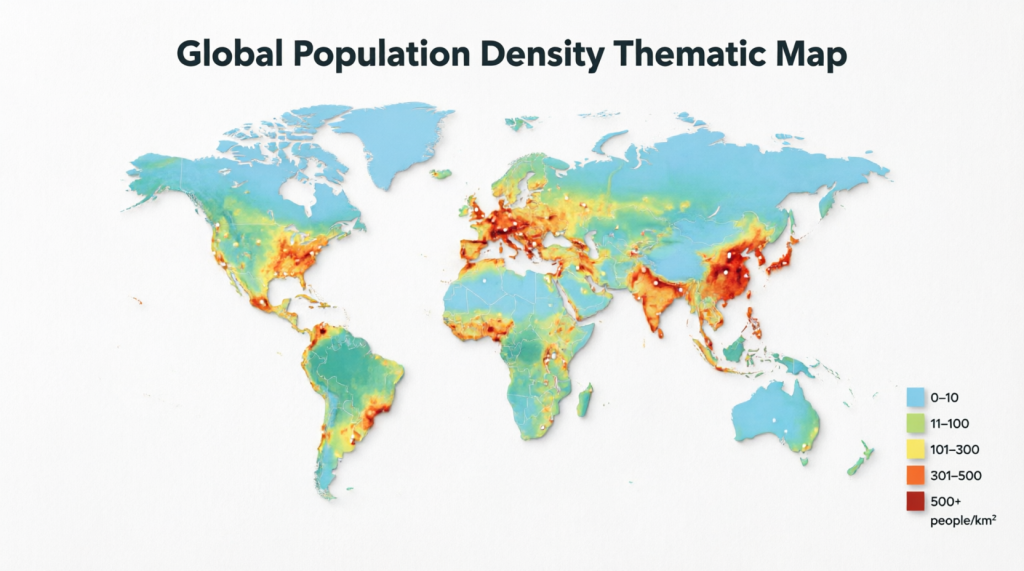
A thematic map is a map built around a single theme or dataset, such as population density or climate patterns, rather than trying to show every geographic feature at once. It uses visual elements such as color shading, scaled symbols, or distorted shapes to highlight how that theme varies across space. The base geography stays in the background to provide context while the data takes center stage. This focused approach helps viewers quickly grasp distributions and relationships that raw numbers or general reference maps often hide.
How is a thematic map different from a regular reference map?
Reference maps aim to show the locations of many features, such as roads, rivers, and cities, so you can navigate or understand the basic layout. Thematic maps, by contrast, deliberately simplify the base and emphasize one topic so patterns become obvious. Think of reference maps as directories and thematic maps as focused stories. Both have value, but they answer different questions. One tells you where things are. The other reveals what is happening there and why it might matter.
What are some common types of thematic maps?
Common styles include choropleth maps that shade regions by average values, dot density maps that use scattered dots to show quantities, graduated symbol maps that vary circle sizes for magnitudes at points, cartograms that resize areas according to data, flow maps that illustrate movement with line thickness, and isoline maps that connect equal values with smooth lines. Each type suits different kinds of data and storytelling goals. Choosing the right one depends on whether you want to compare regions, show exact counts, or highlight connections between places.
Why do thematic maps matter in everyday life?
Thematic maps appear in weather forecasts, election coverage, public health reports, business planning, and environmental studies. They help governments allocate resources, companies choose locations, researchers spot trends, and citizens understand issues such as inequality and climate change. Because they turn complex statistics into intuitive pictures, they speed up insight and support better decisions across almost every field that involves geography and data.
Can thematic maps be misleading, and how can I avoid being fooled?
Yes, they can mislead through poor data classification, confusing colors, size distortions in cartograms, or maps that do not properly normalize rates. Large areas can visually dominate even when they contain fewer people or events. To stay sharp, always read the legend carefully, check what the data actually measures, and remember that every map simplifies reality. Reliable sources usually explain their methods, which helps you judge how trustworthy the picture really is.
How can someone create a thematic map today without special training?
Free and user-friendly tools like QGIS, ArcGIS Online, Tableau Public, and even some spreadsheet programs now make it possible for beginners to build choropleth or symbol maps in a few steps. Start with public datasets from census bureaus or open data portals, pick a map type that fits your numbers, and apply clear colors and labels. Many online tutorials walk you through the process, so you can go from spreadsheet to shareable map surprisingly fast. The key is to start simple and focus on clarity rather than fancy effects.
Ready to explore more? Open an interactive map on a news site or try building one yourself. Once you understand what a thematic map is, the world of data starts to look a lot more interesting.